Basic Usage Example
[1]:
from IPython.display import display, HTML
display(HTML('<a target="_blank" href="https://colab.research.google.com/github/WaterFutures/EPANET-PLUS/blob/main/docs/examples/basic_usage.ipynb"><img src="https://colab.research.google.com/assets/colab-badge.svg" alt="Open In Colab"/></a>'))
This example demonstrates how to load an .inp file, retrieving some basic information, and running a hydraulic simulation.
EPANET-PLUS is available on PyPI and can be installed via pip install epanet-plus:
[2]:
%pip install epanet-plus --quiet
Note: you may need to restart the kernel to use updated packages.
[3]:
from epanet_plus import EPyT, EpanetConstants
import matplotlib.pyplot as plt
Load an .inp file in EPANET using the toolkit class EPyT:
[4]:
epanet_api = EPyT("net2-cl2.inp")
Listing all nodes and links:
[5]:
print(f"All nodes: {epanet_api.get_all_nodes_id()}")
print(f"All links: {epanet_api.get_all_links_id()}")
All nodes: ['1', '2', '3', '4', '5', '6', '7', '8', '9', '10', '11', '12', '13', '14', '15', '16', '17', '18', '19', '20', '21', '22', '23', '24', '25', '27', '28', '29', '30', '31', '32', '33', '34', '35', '36', '26']
All links: ['1', '2', '3', '4', '5', '6', '7', '8', '9', '10', '11', '12', '13', '14', '15', '16', '17', '18', '19', '20', '21', '22', '23', '24', '25', '26', '27', '28', '29', '30', '31', '32', '34', '35', '36', '37', '38', '39', '40', '41']
Retrieving the simulation duration and hydraulic time step:
[6]:
print(f"Simulation duration in seconds: {epanet_api.get_simulation_duration()}")
print(f"Hydraulic time step in seconds: {epanet_api.get_hydraulic_time_step()}")
Simulation duration in seconds: 2880000
Hydraulic time step in seconds: 3600
Retrieving the demand model:
[7]:
print(f"Demand model: {epanet_api.get_demand_model()}")
Demand model: {'type': 0, 'pmin': 0.0, 'preq': 0.10000000149011612, 'pexp': 0.5}
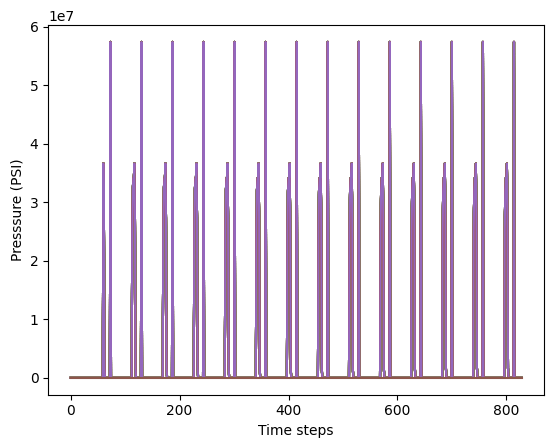
Run hydraulic simulation and plot pressure at each node (at every simulation step):
[8]:
epanet_api.openH()
epanet_api.initH(EpanetConstants.EN_NOSAVE)

tstep = 1
r = []
while tstep > 0:
    t = epanet_api.runH()

    r.append(epanet_api.getnodevalues(EpanetConstants.EN_PRESSURE))

    tstep = epanet_api.nextH()

epanet_api.closeH()
[9]:
plt.figure()
plt.plot(range(len(r)), r)
plt.xlabel("Time steps")
plt.ylabel("Presssure (PSI)")
plt.show()
Do not forget to close the EPANET by calling close():
[10]:
epanet_api.close()
[ ]: